


Remote sensing data is one of main factors affecting remote sensing research methods, experimental design and solutions, etc. In this study, the articles published on the JournalRemote Sensing of Environment during 1999~2018 were collected to quantitatively analyze the utilization situation of remote sensing data and research hotspots using bibliometrics and knowledge graph methods. The results showed that more and more specific professional sensors, remote sensing data, derived data emerged rapidly. Meanwhile, microwave remote sensing and LiDAR were burgeoning, and the structure of application of optical, microwave and LiDAR remote sensing data had changed significantly, from 8∶1∶1 to 5∶3∶2 during the past decades, multi-angle and airborne observation platform get favors of scientists. The improvement of remote sensing data and analytical methods were continuously promoting a systematic and comprehensive understanding of complex geo-ecological processes and impact of human activities on environment.
Soil moisture is a key variable in land surface system. Using active microwave remote sensing observations, especially Synthetic Aperture Radar (SAR), has been proven a promising way on the estimation of spatial-temporal distribution of surface soil moisture by a lot of studies. However, there is still challenging in this field, because of the impacts caused by surface roughness and vegetation cover. In this context, this paper proposes an optimal estimation approach combined using SAR and optical remote sensing imagery, in order to retrieve vegetation water content, roughness and soil moisture simultaneously. First, water-cloud model is used to correct vegetation effect on microwave scattering process. In this step, vegetation transmittance factor (closed related to vegetation water content) is estimated by using three optical remote sensing indexes, namely, Modified Soil Adjusted Vegetation Index (MSAVI), Normalized Difference Vegetation Index (NDVI) and Normalized Difference Water Index (NDWI). Second, a cost function is constructed based on SAR observations and Oh model simulations, then soil moisture and surface roughness can be estimated through global optimization by shuffled complex evolution algorithm. The proposed method is performed by using Sentinel-1and Landsat 8 data in the middle researches of the Heihe River Basin, retrieved results are validated against ground measurements. Results show a good agreement between remote sensing estimates and ground measurements, which indicates the proposed method can retrieve soil moisture accurately. For soil moisture, the determination coefficient (R 2) is higher than 0.7, the root mean square error (RMSE) is 0.073 m3/m3. With respect to vegetation water content,R 2 is higher than 0.9 and RMSE is 0.885 kg/m2. In the meantime, it is found that the result of estimated vegetation water content and the parameterization scheme of vegetation parameters have pronounced influence on the accuracy of soil moisture estimates, which need to be further addressed in future research.
In this study, a change detection model, constructed using the Sentinel-1 Synthetic Aperture Radar (SAR) data and the simultaneous Normalized Difference Vegetation Index (NDVI) products from the Moderate Resolution Imaging Spectroradiometer (MODIS) and Landsat 8 sensors, is applied to estimate soil moisture in middle reaches of the Heihe River Basin, and the effects of two key parameters on retrieval accuracy are comprehensively investigated. The results show that: (1) when constructing the empirical relationship between backscattering coefficient difference (
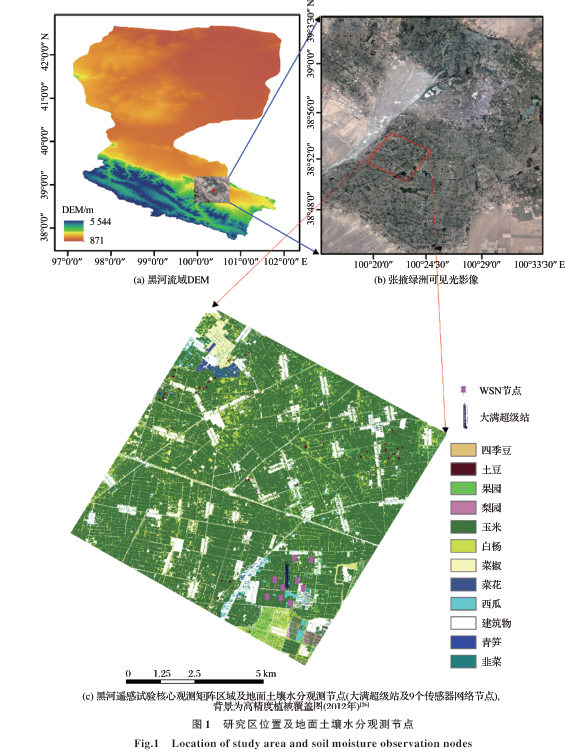
An approach to estimate soil moisture from AMSR2 multi-brightness temperature observations is preliminarily investigated in the middle and upper reaches of the Heihe River Basin (HRB). Based on the statistical relation between soil moisture and microwave emissivity from soil, a method called “4-grid cross-fitness” is used to obtain the statistical relation between in-situ soil moisture and soil temperature measurements of 4 WSN pixels in the upper reaches of the HRB during the period July, 2013~June, 2014. Then soil moisture in the middle and upper reaches of the HRB is retrieved. The retrieved soil moisture is compared with WSN soil moisture measurements, along with AMSR2 soil moisture products and GLDAS soil moisture product during the period July, 2014~October, 2014. The results show that the retrieved soil moisture perform remarkably better than the other 5 soil moisture products.Moreover, spatial patterns of the retrieved soil moisture and GLDAS soil moisture products are compared and analyzed as well via the auxiliary DEM and Landcover datasets. The results indicate that the spatial distribution of retrieved soil moisture perform with higher reasonability than GLDAS. This method may probably provide a feasible way for soil moisture retrieval over basin scales.
Unfrozen water and ice co-exist in frozen soil, and their mutual transformation, namely freezing-thawing change, profoundly affects the surface water circulation and energy budget in cold regions. Passive microwave remote sensing technology is the main means of soil water monitoring, but it is mostly applied to the retrieval of water in non-frozen soil, and the retrieval of unfrozen water in frozen soil under negative temperature environment is less. Based on the brightness temperature measurement data obtained from the SMAP satellite ascending and descending overpass and the improved zero-order microwave radiation model applicable to the Tibetan Plateau, using Single-Channel Algorithm (SCA) and Dual-Channel Algorithm (DCA), The content of unfrozen water in the seasonal frozen soil in Maqu region which is the source region of the Yellow River in the east of Tibetan Plateau was inverted. The results show that the in-situ measured values dynamics are better captured by the retrieval values based on the brightness temperature measurement at the different moments of SMAP satellite overpass and different algorithms of soil unfrozen water in the study area(the correlation coefficient R is greater than 0.9). Among them, the retrieval results based on the brightness temperature measurement at the SMAP descending are significantly underestimated in the transition season of freezing-thawing cycle, while the retrieval results based on the brightness temperature measurement at the SMAP ascending are more accurate. The unbiased root-mean-square error (ubRMSE) of the retrieval values which obtained based on the V-polarization Single Channel Algorithm (SCA-V) and DCA and the in-situ values is 0.035 m3m-3 and 0.039 m3m-3, respectively, which are both meet the established requirements of SMAP mission. Compared with SMAP standard products, the soil moisture in warm season obtained by retrieval based on SCA-V algorithm is more accurate in this study. In addition, the algorithm adopted in this study can successfully retrieval the dynamic change of soil unfrozen water during freezing period, so it is more suitable for the retrieval of soil moisture under freezing and thawing conditions in Tibetan Plateau.
SMOS and SMAP are both dedicated to acquire global soil moisture information with L band radiometer. The parallel comparison between them is the key foundation for the integration of a consistent global soil moisture dataset. Though the nominal passing time of SMAP and SMOS are designed fixed, the precise time they move overhead locally may not be the same because of the variation in spatial and temporal, practically it is unable to match SMAP, SMOS and field observations in temporal rigidly, therefore the evaluation on their soil moisture retrievals is hard to carry. Research on this mismatch problem is made in the continental United States; firstly, the overlapping period of the two satellites is determined on the basis of a statistic on the time stamp of 2016~2017 SMOS and SMAP soil moisture data; then, the natural variation characteristics of surface soil moisture within this period is studied using in-situ data which having high density in temporal and large scale in spatial. Results showed that, by grouping the samples in the three conditions of entire, no precipitation and with precipitation, where the sample ratio of 98.14%, 99.51% and 88.49% in each group, respectively, meaning in most cases, the surface soil moisture presents a variation of 0.007 m3/m3, 0.007 m3/m3 and 0.012 m3/m3accordingly, which is far less than the nominal accuracy of SMOS and SMAP (0.04 m3/m3). It can be demonstrated preliminarily, ① the direct comparison of SMOS and SMAP soil moisture retrievals (L2 data) is acceptable, ② validation error induced by the difference of passing time can be neglected.
In order to reduce the complexity of SMOS official soil moisture retrieval algorithm and improve the accuracy of soil moisture retrievals, a new retrieval strategy on SMOS soil moisture retrieval algorithm was developed. In the new retrieval strategy on SMOS soil moisture retrieval algorithm, the fixed step size (0.001 m3/m3) was used to replace the flexible step size obtained by the SMOS matrix operation. The multi-parameter was changed to a single-parameter in the cost function. The data from 44 USCRN sites in the United States were compared with the soil moisture retrieved from SMOS official algorithm as well as the adjustment of SMOS algorithm. The results show that compared with the SMOS official algorithm, the average absolute deviation, root mean square error,and unbiased root mean square error of the adjustment of SMOS algorithm are reduced by 0.012 m3/m3, 0.018 m3/m3,and 0.020 m3/m3,respectively.
The commonly used passive microwave soil moisture inversion algorithms include Single Channel Algorithm at H polarization (SCA-H), Single Channel Algorithm at V polarization (SCA-V), Dual-Channel Algorithm (DCA), Microwave Polarization Ratio Algorithm (MPRA) and Extended Dual Channel Algorithm (E-DCA). The five retrieval algorithms have different performance, systematic evaluation and analysis of these inversion algorithms will contribute to the improvement of the retrieval algorithm and the release of satellite soil moisture products. Verification of satellite product could bring some problems, such as scale matching and spatial heterogeneity. In order to avoid these issues, the above five soil moisture inversion algorithms are implemented, compared and analyzed based on ground-based microwave radiometer observation and supporting soil and vegetation parameter measurement data. The results show: (1) SCA has the best inversion performance. SCA-H has the highest correlation (R=0.83), and SCA-V has the smallest inversion error (RMSE=0.028 m3/m3, BIAS=-0.011 m3/m3), but SCA needs the accurate vegetation water content as an input. (2) The other three algorithms can get rid of the use of vegetation-aided data, with slightly poor performance but also meet the satellite detection requirements (less than or equal to 0.04 m3/m3). Among them, E-DCA and MPRA are slightly worse than the DCA. However, E-DCA is more advantageous in the vegetation water content inversion in our study.
Soil moisture is an important state variable connecting the land surface-atmosphere system, and its information can be efficiently acquired by the new technique of microwave remote sensing. Accurate interpretation of the microwave soil moisture products qualities and in-depth understanding of their temporal and spatial distributions are important prerequisites for their successful application in earth science through data assimilation. In this study, three microwave soil moisture products, FengYun-3C(FY-3C), Soil Moisture Active Passive (SMAP) and Advanced Scatterometer(ASCAT), were evaluated over China based on the triple collocation (TC) method. The abilities of three products to obtain temporal and spatial variations of soil moisture were illustrated by Hovm?ller diagram. The results show that: (1) SMAP generally outperforms ASCAT and FY-3C, with highest TC-based signal-to-noise ratio(SNR) under different land use types. The TC-based SNRs are 1.668dB, -0.316dB and -2.182dB for SMAP, ASCAT and FY-3C respectively; and their correlation coefficients with ground observations are 0.514, 0.501 and 0.209, respectively. (2) The accuracies of FY-3C and ASCAT in Northwest China are overall higher than those in the southern China. All three products can capture the latitudinal and longitudinal gradients of soil moisture, whereas their seasonal fluctuations are higher than those of in-situ measurements. Among three products, FY-3C shows highest spatial gradient and strongest seasonal fluctuations. (3) FY-3C product performance is more susceptible to vegetation coverage than ASCAT and SMAP, but it outperforms ASCAT in barren areas. The results of our study could provide useful insights for assimilating microwave soil moisture products into land surface models to improve hydrological prediction.
Based on soil moisture and freeze/thaw comprehensive experiments conducted at the north-eastern part of the Tibetan Plateau, the L-band brightness temperature, the in-situ soil moisture and temperature, vegetation leaf area index are measured simultaneously for the purpose of evaluating performances on forward brightness temperature simulation and soil moisture retrieval using four dielectric constant models, including Wang-Schmugge, Mironov, Dobson, and Four-Phase model. The forward brightness temperature simulations indicate that the difference of simulated brightness temperature between Wang schmugge model and the other three dielectric constant models is most significant at lower soil moisture content condition (soil moisture is less than 0.23 m3·m-3) , nevertheless, the difference of Mironov model simulation is most significant in contrast with the ones of other three models at higher soil moisture condition (soil moisture is greater than 0.23 m3·m-3). The practical retrieval of soil moisture from the ground-based radiometer measurements indicate that Wang-Schmugge model can effectively reduce the underestimation of soil moisture at the horizontal polarization, this resulted an improvement to the accuracy of retrieved soil moisture. Mironov model can reduce the underestimation of retrieved soil moisture at the vertical polarization. In accordance with a state-of-the-art parameterization scheme, the evaluation of performances of four dielectric constant models at the typical alpine meadow is potential for selecting optimum soil moisture retrieval by using soil dielectric model from space-borne L-band radiometer observation over the Tibetan Plateau
Soil moisture is the basic factor for monitoring crop drought. Based on the microwave remote sensing soil moisture products of ESA from 1978 to 2014, the statistical database of China's economic and social development and meteorological data, combined with the Soil Moisture Deficit Index (SWDI), the relationship between the degree of drought in Northeast China and corn yield was analyzed. The results show that: (1) the drought level of the three provinces is increasing from northeast to southwest; (2) the SWDI drought index calculated based on CCI (Climate Change Initiative) soil moisture products has a good correlation with rainfall and temperature, which can be used to evaluate the severity of drought; (3) the correlation between SWDI and maize yield is the best in the key water demand period (July), and R2 of Heilongjiang, Jilin and Liaoning provinces are 0.43, 0.78 and 0.38 respectively, which is very suitable for quantifying the effect of drought on maize yield. This conclusion has important guiding significance for the study of the influence of soil moisture content on crop yield and the relevant agricultural decision-making.
It is crucial for soil moisture assessment to know the prediction accuracy of inversion model. Urban forest surface soil in a gully-loess region (Yan’an), was taken as the research object, and the three scenes of Landsat satellite remotely sensed imagery in different periods and soil moisture sensor in situ measurement data were used as the data source. The parameters of TOTRAM (Thermal-Optical TRApezoid Model) and OPTRAM (OPtical TRApezoid Model) were obtained through the scatter diagram of pixels in two-dimensional spaces (LST-NDVI and STR-NDVI, LST
The sea surface temperature in the southern South China Sea has a significant influence on the climate change of China land. In the paper, on the basis of the geometric correction and cloud removal of MODIS basic data in the southern South China Sea, the atmospheric transmittance was calculated by MODTRAN Model, and the brightness temperature was calculated by the radiance intensity of the MODIS 31, 32 channels. The split-window algorithm was used to retrieve the sea surface temperature in the southern South China Sea. Finally, the accuracy was evaluated byR 2, SSE, RMSE and the regression analysis between retrieved temperature and the products temperature or ground measured temperature.R 2 is lager than 0.8. SSE and RMSE are all smaller. The inversion accuracy is good. The research showed the distinct seasonal variation of lower temperature in autumn and winter and higher temperature in spring and summer. The research still showed the fundamental variation of temperature with declines from the near shore to the center of the sea, and lowest temperature over the deep basin. The sea surface temperature was affected by variations of weather. The sea surface temperature was positively correlated with El Ni?o, and was negatively correlated with La Ni?a.
The spectral information of water is weak, and the commonly used radiation transfer model has poor accuracy in atmospheric correction of water body. Based on the Gaofen-1 WFV image (GF-1/WFV) and the synchronous in situ spectra covering Taihu Lake on 29th, April, 2016, the sensitivity analysis of the input parameters in 6S model was first performed, and then the image was corrected using 6S model using the observation geometry calculated pixel-by-pixel, the partitioned aerosol type and the Aerosol Optical Depth (AOD) determined by the partitioned dark pixel and Spline interpolation. The experimental results show that the aerosol type has the greatest influence on the 6S atmospheric correction results. Compared with the FLAASH method, the 6S method using the observation geometry and aerosol parameters calculated pixel-by-pixel significantly improved the atmospheric correction accuracy, with the ARE (Average Relative Error) of the four bands reduced by 1.84%,7.78%,4.79%,17%. The 6S atmospheric correction method pixel by pixel with the input of accurate atmospheric parameters can improve the correction accuracy of the remote sensing reflectance above water surface.
Surface albedo is one of the driving factors in surface radiant energy balance and surface-atmosphere interaction.It is widely used in surface energy balance, medium and long-term weather forecasting and global change research.This study aims to validate the surface albedo retrieved from FY-3C MERSI. This paper selected four regions in Africa and North America as study areas to validate the retrieved albedo from the reflectance data and angle data of FY-3C MERSI at 250 m resolution in 2014. The semi-empirical kernel-driven BRDF(bidirectional reflectance distribution function) model RossThick-LiSparseR and least squares fitting method were used to calculate the parameter of BRDF. Then four narrow-band black-sky albedos and four narrow-band white-sky albedos can be obtained by angle integration. Finally, the cross-validation of FY-3C surface narrow-band albedo products with MODIS albedo products (MCD43A3) was carried out. The results show that the
With the rapid development of China's economy and the acceleration of urbanization, PM2.5 has become one of the major factors affecting atmospheric environmental pollution in China. The use of geostationary satellite data can obtain a wide range of regional PM2.5information, providing irreplaceable data sources for China's atmospheric environment monitoring, control, and forecasting. This paper uses the geostationary satellite GOCI data, based on Aerosol Optical Depth (AOD) retrieveal, combined with meteorological factors, and uses multivariate statistical analysis to study the remote sensing retrieval of PM2.5 in the study area. The results show that the multivariate statistical model based on AOD shows a good agreement between the estimated PM2.5 concentration and the observed values, and the fitting degreeR 2 is 0.665 2. After multivariate statistical modeling of dry AOD obtained after moisture correction of AOD, the fitting degree R2 between the predicted concentration of PM2.5 and the observed value reached 0.702 6, which proved the relationship established betweenthe “dry” AOD after the humidity correction and PM2.5 is more reliable.The use of GOCI-retrieved AOD to calculate PM2.5 concentration fully reflects the advantages of GOCI as a geostationary satellite in spatial resolution and temporal resolution. In terms of spatial resolution, the spatial resolution of AOD based on GOCI satellite reachs to 500 meters, which is better than MODIS 10 km AOD product.In terms of temporal resolution,hourly AOD monitoring from 9:00 to 16:00 based on GOCI can be obtained,which is better than MODIS twice daily AOD products.
Leaf Area Index (LAI) is an important vegetation structure parameter in biogeochemical cycling. In view of the lack of LAI inversion in the multiple growth period of summer maize based on GF-1 WFV satellite images in China, this study constructs a BP neural network model (BP1 model and BP2 model) based on different hidden layers, and compares and analyzes the accuracy of the inversion between the BP1 model, BP2 model and 6 statistical models (NDVI、RVI、DVI、EVI、SAVI、ARVI). Based on the measured data, BP1 model and BP2 model are used to map the LAI dynamic changes of summer maize. The results show that LAI has good correlation with 6 common statistical models, and the fitting degree of the NDVI exponential equation regression model is the best. The overallR 2 of BP neural network model is slightly smaller than the statistical model, while RMSE is less than the statistical model, and the errors with the measured value is smaller than the statistical model. So both the statistical model and the BP neural network model have advantages and disadvantages. The BP2 model is superior to the BP1 model inR 2 and RMSE, and can obtain more accurate inversion values, and the overall prediction accuracy of BP2 is higher. Based on the BP neural network simulation of summer maize growth period inversion, the LAI value presents a slow increase to the gradual decrease of S type change process, which is basically in line with the crop growth rules. The study combines with the BP neural network model established by different hidden layers to provide a method for the application of GF-1 satellite in the application of crop leaf area index multiple growth period inversion.
The ESTARFM (Enhanced Spatial and Temporal Adaptive Reflectance Fusion Model) is a classic spatiotemporal filter-based algorithm, which is used in the many fields. The similar pixel selection process in the ESTARFM model is affected by the size of the size of search window and the number of classifications. In the current study, the size of the search windows is more uniform, and the number of classifications lacks uniformity. In order to reduce the influence of the number of classifications in the ESTARFM algorithm on the performance of the algorithm. The similar pixel selection method in the STNLFFM (A Spatial and Temporal Nonlocal Filter-Based Data Fusion Method) combined with the ESTARFM model to propose the ESTARFM_NL model. The study designed two sets of data under different conditions of phase change for comparative analysis. The results show that the overall distribution of the relative error histogram of ESTARFM_NL and ESTARFM is tight and consistent. When the fusion results are evaluated by the average relative error and correlation coefficient, the difference between the two algorithms is considerable, indicating that the fusion accuracy of the two algorithms is equivalent. Comparing the efficiency of the two algorithms, we found that the ESTARFM_NL running time can be greatly reduced. Therefore, ESTARFM_NL provides an alternative fusion scheme for large-area or long-term sequence remote sensing data with large data volume.
The GaoFen4 (GF4) satellite is China’s first geo-synchronous orbit remote sensing satellite. With the advantages of high frequency and wide width, it can provide fast and stable optical remote sensing images for agricultural, forestry, disaster reduction, meteorology, environmental protection, water conservancy and other applications in China. Efficient image automatic cloud detection helps to further improve the utilization efficiency of GaoFen4 images. CDAG(Cloud Detection Algorihtm-Generating)Cloud detection is an automatic cloud detection algorithm based on spectral analysis of pixel components, which can effectively reduce the influence of mixed pixels, complex surface structure and atmosphere. This paper aims to explore the application of CDAG algorithm in cloud detection of GaoFen4 multispectral imagery (GF4-PMS). Firstly, different cloud types and surface cover types were selected from hyperspectral images (AVIRIS) to establish cloud pixel library and clear sky pixel library. Next, the pixel library of multispectral images was simulated based on Hyperspectral pixel library and spectral response function of GF4-PMS sensor. Then, according to the spectral difference analysis of broken cloud, thin cloud, thick cloud and non-cloud pixel, the similarity probability analysis was performed on the to-be-detected pixel of the GF4-PMS image and the terminal pixel, and the GF4-PMS image cloud detection based on the optimal threshold automatic iteration was realized. Finally, cloud detection accuracy verification was carried out from multiple indicators such as cloud pixel correct rate, clear sky pixel correct rate, false positive rate and missed rate. The results show that AVIRIS images can effectively extract terminal pixel libraries for GF4-PMS image cloud detection. Clouds of Various types on GF4-PMS images can be better identified based on the CDAG algorithm. The accuracy of detection results for broken clouds, thin clouds and thick clouds with different time phases and different underlying surfaces can reach more than 90%. Therefore, the cloud detection method based on the priori terminal pixel library has a good application value for improving the utilization efficiency of GF4-PMS images.
Aiming at the complexity of traditional methods for feature extraction about satellite cloud images, and the difficulty of developing deep convolutional neural network from scratch, a parameter-based transfer learning method for classifying typhoon intensity is proposed. Take typhoon satellite cloud images published by Japan Meteorological Agency, which includes 10 000 scenes among nearly 40 years to construct training and test typhoon datasets. Three deep convolutional neural networks, VGG16, InceptionV3 and ResNet50 are trained as source models on the large-scale ImageNet datasets. Considering the discrepancy between low-level features and high-level semantic features of typhoon cloud images, adapt the optimal number of transferable layers in neural networks and freeze weights of low-level network. Meanwhile, fine-tune surplus weights on typhoon dataset adaptively. Finally, a transferred prediction model which is suitable for small sample typhoon datasets, called T-typCNNs is proposed. Experimental results show that the T-typCNNs can achieve training accuracy of 95.081% and testing accuracy of 91.134%, 18.571% higher than using shallow convolutional neural network, 9.819% higher than training with source models from scratch.
Soil salinization is an important challenge to achieve sustainable use of land resources. The appropriate method for remote sensing quantitative inversion in the coastal Yellow River Delta region of China can provide technical reference for regional salinization monitoring and prevention. Utilizing Landsat 8 OLI image and field measured data, we extracted key surface characteristic parameters, quantitatively discussed the law and relationship between soil salinity and surface biophysical parameters and established a soil salinity inversion model. The results show that the inversion precisions of Albedo-MSAVI, SI-Albedo and SI-NDVI feature space are 83.4%, 88.8% and 80.6% respectively. The analysis shows the SI-Albedo model is suitable for the inversion of salinization level in Binhai areas. For Albedo-MSAVI and SI-NDVI models, they have certain reference significance for salinization information extraction in inland arid and semi-arid areas. Based on the inversion of the SI-Albedo feature space with the highest accuracy, the level of salinization in Kenli County is generally high-low-high trends from the east to the west, which is consistent with the formation mechanism of salt accumulation in this area.
The population data is usually calculated by administrative districts. When comprehensive analysis is carried out with other spatial data, there are often many problems such as different scales. The spatial data of population data is the process of exploring the spatial distribution of population. The final result can be other spatial correlation research. It lays the foundation and can also be directly applied to disaster impact assessment and other fields, which has important academic significance and application value. The population spatialization model is based on the spatial relationship between population and land use and traffic road network data. The population is divided into urban population and rural population. The land use type is empowered by the relative weight method, and the traffic network data is used to correct it. Spatial distribution of rural population; analysis of different ways of affecting different levels of traffic road network data, comprehensive distribution of urban population, and finally through the planning and other methods to superimpose and integrate different types of data. The results of population data spatialization results show that China's population is very sensitive to altitude and topography. Low-altitude plains and terraces only account for 16.49% of China's land area, while the population living on it accounts for 54.88% of the total population. On the contrary, China's mountains The proportion of hills is 55.78%, but only 22.11% of the population is distributed. The eastern population is concentrated in the Huanghuaihai area, the Sichuan Basin, the Yangtze River small and medium-sized tourist, and the Northeast Plain. The urban population in China presents a typical “point-axis” distribution. The distribution along the main traffic lines is more prominent.
The monsoon has obvious influences on biological migration, cultural formation, regional architectural structure, and changes in meteorological elements, but lacks study on the impact of the PBL SO2. In this paper, we make a study on the temporal and spatial distribution characteristics of the PBL SO2 in Chinese monsoon region by OMI SO2 from 2005 to 2014 and OMPS NMSO2 from 2015 to 2017 in order to identify the influence of monsoon on PBL SO2 in different regions. Four typical cities were selected to do correlation analysis, and HYSPLIT model was run for backward Trajectory simulation by the corresponding date of daily SO2 columns are greater than the monthly average in January 2012. The results show that china’s PBL SO2 is spatial heterogeneity; the change of winter and summer monsoon has obvious influence on the PBL SO2, temperature and pressure are the main factors affecting the concentration of the PBL SO2. Regional meteorological conditions have large differences in the dry and wet deposition, photochemical reaction and wind diffusion of SO2; the winter airflow has a greater impact on the increase of the SO2, internal discharge in the Sichuan Basin, and southwesterly airflow which comes from the Indian Peninsula and the Bay of Bengal has a significant effect on the increase of SO2 in Chongqing. Yinchuan is affected by the airflow that comes from the Mongolian Plateau or the Tianshan Mountains; Tianjin and Hangzhou are influenced by airflow come from the North China Plain or the Mongolian Plateau.
Fujian province has the highest forest coverage rate in China for decades, which has played an important role in maintaining a good ecosystem quality in southeastern China. This study conducted an investigate aiming to find out the spatial and temporal changes of the vegetation status in Fujian and the impact factor involving in the vegetation growth during the period from 2000 to 2017, using the summer data of MODIS Enhanced Vegetation Index (EVI) product, associated with meteorological and non-meteorological data. The results showed that the mean EVI of Fujian rose as a whole during the 17 study years, from 0.454 in 2000 to 0.505 in 2017, increased by 11.2% in the period. This indicates that the overall vegetation status in Fujian has been improved, especially in, south and west parts of the province, while eastern coastal areas have shown decrease in vegetation coverage. Correlation analysis showed that during the study period, meteorological factors (temperature and precipitation) had no significant impact on the provincial EVI change, and the improvement of the vegetation status mainly due to non-meteorological factors. Both the construction of the ecological province in Fujian starting in 2003 and the soil erosion treatment starting in 2012 have strong relationships with vegetation increase. The increase of forest coverage rate and the decrease of soil erosion area have contributed significantly to the enhancement of Fujian’s EVI in the past 17 years.
The Protectorate of the Western Regions was the administrative agency established by the Western Han government in the Western Region. It was located in the area of strategic importance along the Silk Road in Luntai county of Xinjiang Uygur Autonomous Region. However, its accurate location is still inconclusive. From 2015 to 2017, according to the environmental characteristics of the western arid zone, we identified archaeological features such as moat, city wall and city gate based on the analysis of the shape and spectral characteristics in remotely sensed data (visible light images, radar images and historic aerial photo), using a method integrating remote sensing, geophysics, fieldwork and spatial analysis. These archaeological features were verified via geophysics and archaeological drilling, and the internal structure of the ancient city has been preliminarily explored. Finally, it was concluded that the ancient city of Koyuk Shahri was the Protectorate of the Western Regions, based on the comprehensive textual research of the site location, distances to cities in the Western Region according to the Book of Han, the shape and structure of the cities, the specifications, and the absolute dating of the sites.